

Quick Links to Main Topics:
Go To BottomThis section provides an introduction to different waveforms and their characteristics. We introduce concepts such as wavelength, frequency, and period. Skill level two is an introductory skill level and is meant for those with minimal exposure to the mathematics associated with sound and various types of waveforms.
A Sine Wave is a Periodic waveform. This means that after one complete cycle through its range of values it will repeat itself. The Square Wave and the Sawtooth waveforms discussed later are also periodic waveforms. A periodic signal is defined as:
, where is the period of the signal, and
Sine Equation:
The sine wave can be represented as a function of time, given Amplitude, Frequency, and Phase Shift:
where:
So what does all this mean?
Frequency () is the rate at which something occurs. So when dealing with signals and waveforms it is specifically how often a waveform cycles through its full range of values in a given amount of time. For a sinusoidal waveform this means: How many times has it gone from 0 to 2π; The picture below depicts a complete cycle of a sine wave.
Frequency is generally measured in Hertz (Hz), which means how many cycles in one second. This can be seen by the equation, , where t represents the time (in seconds) we are observing the signal for. If we can easily observe how many cycles were completed in one second, as in the figure below, then this equation is useful. Otherwise we may have to determine the frequency using the period.
Period () is the time (in seconds) it takes for a signal to cycle through its full range of values one time.
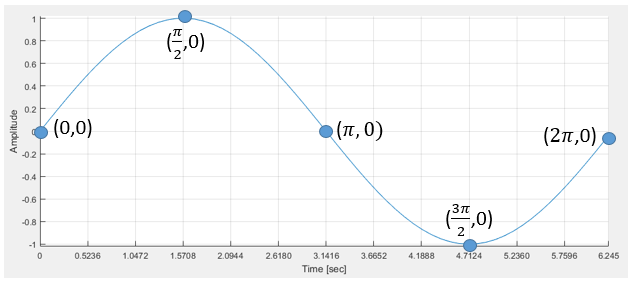
For the following examples we will utilize the figure below:

Example 1: Determine the frequency of the waveform above.
Given:
Determine from the graph. Observe that the graph goes from 0-1 sec.
By counting the number of complete sine waves we can see that
Equation:
Solution:
Therefore: It can be said that if a sinusoid travels through its full range 4 times in 1 second it has a frequency 4 Hz
Example 2: Use the period in the graph above to determine the sine waves frequency
Given:
Equation:
Solution:
Therefore: It can be said that if a sinusoid travels through its full range in 0.25 seconds it has a frequency of 4 Hz.
It should be expected that both of these methods yield the same answer. The frequency does not change regardless of how it is measured.
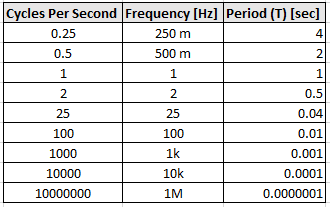
Practice:
Use the table below to try and determine the values in each category. Cover two categories and use the remaining category to determine what values they should be.
The following has been included to better illustrate these concepts.
This picture shows a sinusoid with frequencies of 1 Hz (blue), 5 Hz (red), and a sinusoid increasing in frequency from 1 to 5 Hz. As you can see the 5 Hz (red) signal completes a cycle much faster than the 1 Hz (blue) signal. You can also see that the 5 Hz signal completes 5 full cycles over the period 0 - 2π. If the frequency is increased the wavelength will decrease and if the frequency is decreased the wavelength will increase.
Wavelength () is an expression of how long a wave is. To determine the wavelength you must know two things. The time that it takes to complete one full cycle of a wave (Period) and also the speed of the traveling wave. In our case we are using sound, so wavelength can be represented by the equation:
,where is the speed of sound
Phase Shift () (Horizontal Shifting) is a representation of the waveform movement along the x-axis (horizontal shift) from its original or zero phase position. A phase shift can be either positive or negative in nature.
Positive Phase Shift:

From the video above we can see that when a sine wave is positively shifted by it will be identical to a cosine wave.
The video below shows that when the sine wave is negatively shifted by it will be identical to a cosine wave.
Negative Phase Shift:
Amplitude () is the "height" from the center of the waveform (vertically) to its highest peak. Looking at the figure below it can be seen that the amplitude is related the radius of the circle. If we were to increase the radius of the circle we would also be increasing the peak amplitude of the waves.
The figure below visualizes what a changing amplitude does to a sinusoid when all other components are kept constant.
Vertical Shift or DC Shift () (Y-offset) is a shift along the y-axis either in the positive or negative direction. A vertical shift will change the center of the waveform (vertically) from zero.
The video below depicts this concept
Although the waveform is being vertically shifted, its amplitude, frequency, and phase remain the same throughout the entire video.
In this application we use multiple transmit signals.We now describe some other waveforms.
A square wave can be represented as a function of time given, amplitude, duty cycle, and frequency/period.
Or
where:
In electronics, a square wave has two stable states, High (ON) and Low (OFF). An ideal square wave is depicted below.
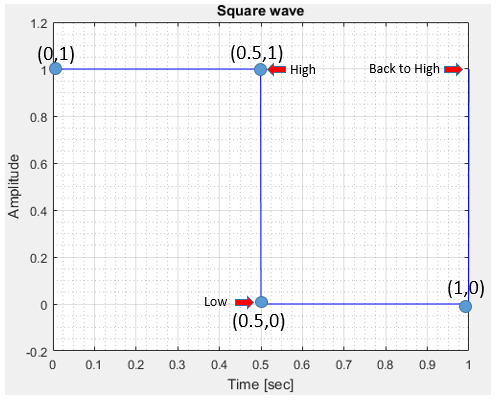
The Frequency () of a square wave is calculated in a similar way to the Frequency of a Sine wave in that it is how many cycles it completes in 1 second.
The Period () of a square wave is similar to the Period of a Sine wave in that it is how long it takes to complete one full cycle.
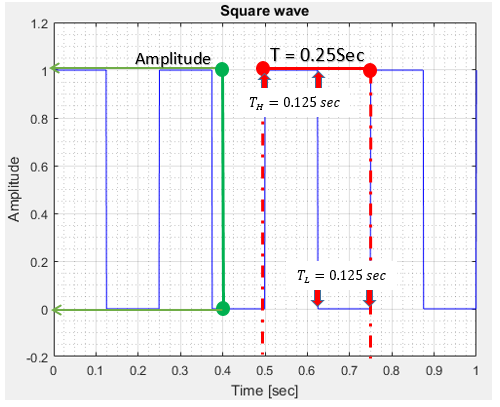
The Duty Cycle () is the percentage of the period where the waveform is "high".
The Amplitude () of a square wave is the "height" of the wave at its highest point in relation to its lowest point.
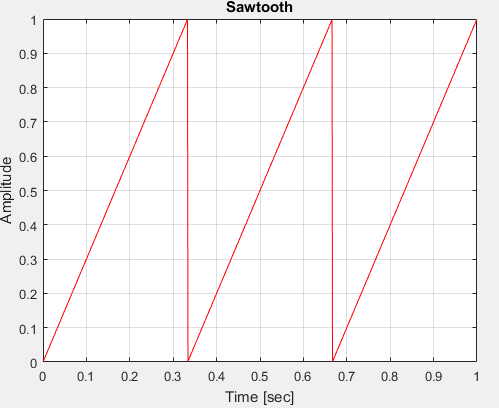
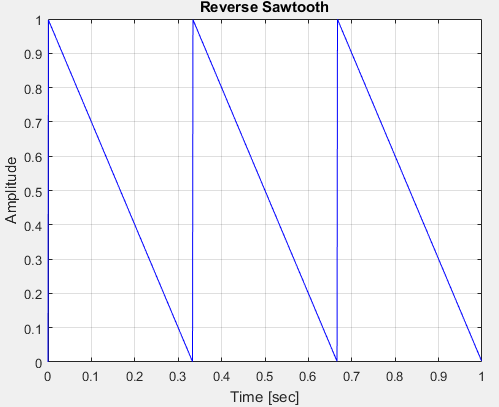
A sawtooth wave can be described in two different ways. It can be a wave that increases linearly to a peak amplitude and then drops to zero or it can be a reverse sawtooth that will instantaneously increase to its peak amplitude and then decrease linearly to zero (or Y-offset). Both are depicted below with their corresponding equations.
Sawtooth
where:
Reverse Sawtooth
where:
A sawtooth wave follows the same characteristics of the periodic waveforms above. It can be changed by:
Modifying its frequency, increasing or decreasing its period, raising or lowering amplitude, horizontally shifting left or right, vertically shifting up or down.
A linear Chirped Sinusoid has many of the same characteristics of a normal sine wave. The Biggest difference is that it is an aperiodic waveform. This means that unlike the previous waveforms, a linearally chirped sinusoid does not repeat itself after one complete cycle.
Instead, the waveform will change in frequency throughout its complete set of values, as shown in the image below.
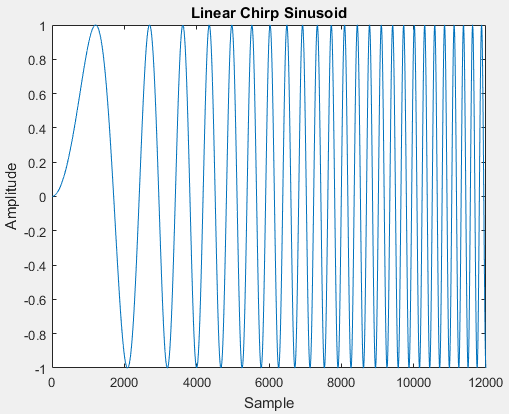
In the above image, the waveform starts off at a frequency of 1 Hz and increases to a frequency of 100 Hz. The frequency at each point is called the instantaneous frequency and can be calculated by using the equation below.
Instantaneous Frequency
Linear Chirped Sinusoid Equation
where:
Due to the complexity of this waveform, it is only introduced here. It will be discussed more in depth in the following skill level.
Test Your Knowledge